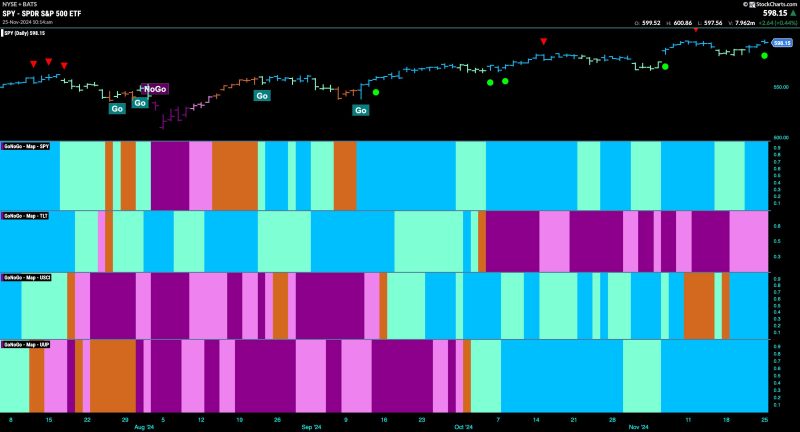
Good morning and welcome to this week’s Flight Path. The “Go” trend in equities has proved to be resilient as we saw strong blue “Go” bars return this week. Treasury bond prices remained in a “NoGo” although this week we did see weaker pink bars as the trend showed weakness. U.S. commodities painted strong blue “Go” bars this entire week as the “Go” trend returned. The dollar has looked strong for some time and we see no signs of this changing as GoNoGo Trend paints another week of uninterrupted strong blue bars.
$SPY Paints Strong Blue “Go” Bars as Strength Returns
The GoNoGo chart below shows that price rallied nicely after falling from its Go Countertrend Correction Icon (red arrow). Price found support at prior high levels and we looked at the oscillator panel to see if GoNoGo Oscillator would find support at the zero line. It did after a few bars of a GoNoGo Squeeze and is now rebounding into positive territory. With momentum resurgent in the direction of the “Go” trend we will watch for price to make an attempt at new highs.
The “Go” trend has remained strong on the longer term chart as we see strong blue bars that followed the Go Countertrend Correction Icon and price has returned to test levels that would be new highs. GoNoGo Oscillator has remained in positive territory and is at a value of 3. With momentum confirming trend direction we will look to see if price can consolidate at these levels and move higher.
Treasury Rates Show Weakness but Remain in “Go” Trend
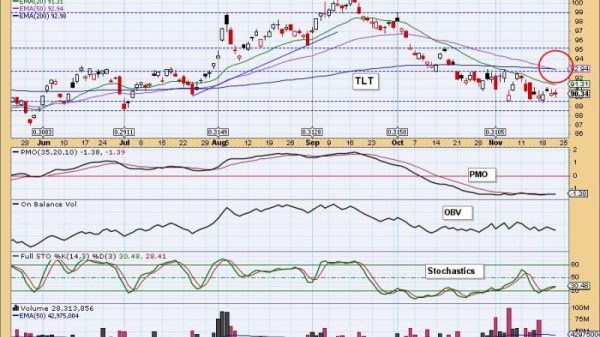
Treasury bond yields painted weaker aqua bars this week as price fell from recent highs. The “Go” trend remains in place but this is a show of weakness. We turn our attention to the oscillator panel and note that it is testing the zero line from above. We will watch to see if it finds support at this level which it should if the trend is to remain healthy.
The Dollar Hit New High Again
Another week of strong blue “Go” bars sees the greenback make another higher high. We are now seeing a Go Countertrend Correction Icon (red arrow) as momentum wanes a touch. With momentum falling and at a value of 3, it will be important to watch to see if it finds support at zero if it gets there. We will need to see momentum stay at or above the zero level for the “Go” trend to remain healthy.


