


The S&P 500 ($SPX), Nasdaq Composite ($COMPQ), and DJIA ($INDU) are trading below their 200-day simple moving averages (SMAs). It doesn’t paint an optimistic picture, but the reality is that the stock market’s price action is more unpredictable than usual.
When President Trump imposed an additional 25% tariff on steel and aluminum imports from Canada, the stock market sold off. However, the selloff eased in afternoon trading, when there was a narrative shift in the tariff and Ukraine/Russia tensions front. But that changed towards the end of Tuesday’s close, with the broader indexes closing lower.
Navigating a headline-driven market is challenging. The Cboe Volatility Index ($VIX), the market’s fear gauge, eased a little on Tuesday, but has risen relatively steeply since February 21. All investors should monitor this closely, especially in a market that fluctuates several times on any given trading day.
Percentage Performance
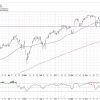
It’s also important not to lose sight of the bigger picture. From a percentage performance point of view, how much damage has been done? To answer this question, it helps to view a PerfChart of the three broader indexes, S&P 500, Nasdaq, and Dow (see chart below).
FIGURE 1. ONE-YEAR PERFORMANCE OF S&P500, DOW JONES INDUSTRIAL AVERAGE, AND NASDAQ COMPOSITE. All three indexes are displaying weakening performance, but are still in positive territory.Chart source: StockCharts.com. For educational purposes.
Over the last year, the performance of the three indexes is in positive territory. The Dow is the weakest of the three, with a 6.87% gain. During the April 2024 low, performance was negative, but during the August low, the Dow skirted the zero level but was able to hang on. Given the trend in the performance of all three indexes is pointing lower, investors should be cautious when it comes to making decisions.
Value Performance
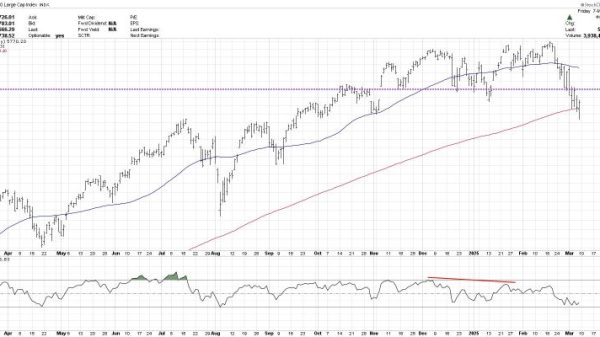
The daily chart of any of the three indexes is bleak. The one that looks the bleakest is probably the tech-heavy Nasdaq. Tech stocks have taken a beating of late, and the Nasdaq has been trading below its 200-day SMA for a few days (see chart below).
The bottom panel displays the percentage of Nasdaq stocks trading below their 200-day SMA. As you can see, it’s below 30%, which indicates an oversold level. There are no signs of reversal on this chart. In August, when the Nasdaq slipped below its 200-day SMA, it quickly recovered.
On Wednesday morning, investors will be tuned in to the February CPI data. Be sure to save the PerfChart in Figure 1 and the chart of the Nasdaq Composite in Figure 2 to your ChartLists. Click on the charts to see the live chart. Monitor them closely, since we’re likely to see a seesawing stock market for a while.
Closing Position
Note that when viewing a PerfChart, you can also compare the performance of different sectors or industry groups in addition to the broader indexes. All you have to do is change the symbols on the chart. If you see confirmed signals of a reversal in any asset class or group, it may be time to reevaluate your portfolio allocations.
Disclaimer: This blog is for educational purposes only and should not be construed as financial advice. The ideas and strategies should never be used without first assessing your own personal and financial situation, or without consulting a financial professional.